
A composite 0-to-10,000 score built from four scored exercises on the QuickBoard sensor board. The two-minute assessment identifies the athlete's or patient's weakest area, and the app automatically recommends the workouts that close the gap.
Traditional physical assessments test one thing at a time. Strength. Range of motion. Hop distance. Each answers a narrow question.
The Agility Rating combines four scored exercises on the QuickBoard sensor board into a single composite score from 0 to 10,000. It captures reactive cognitive-motor performance across five dimensions at millisecond precision.
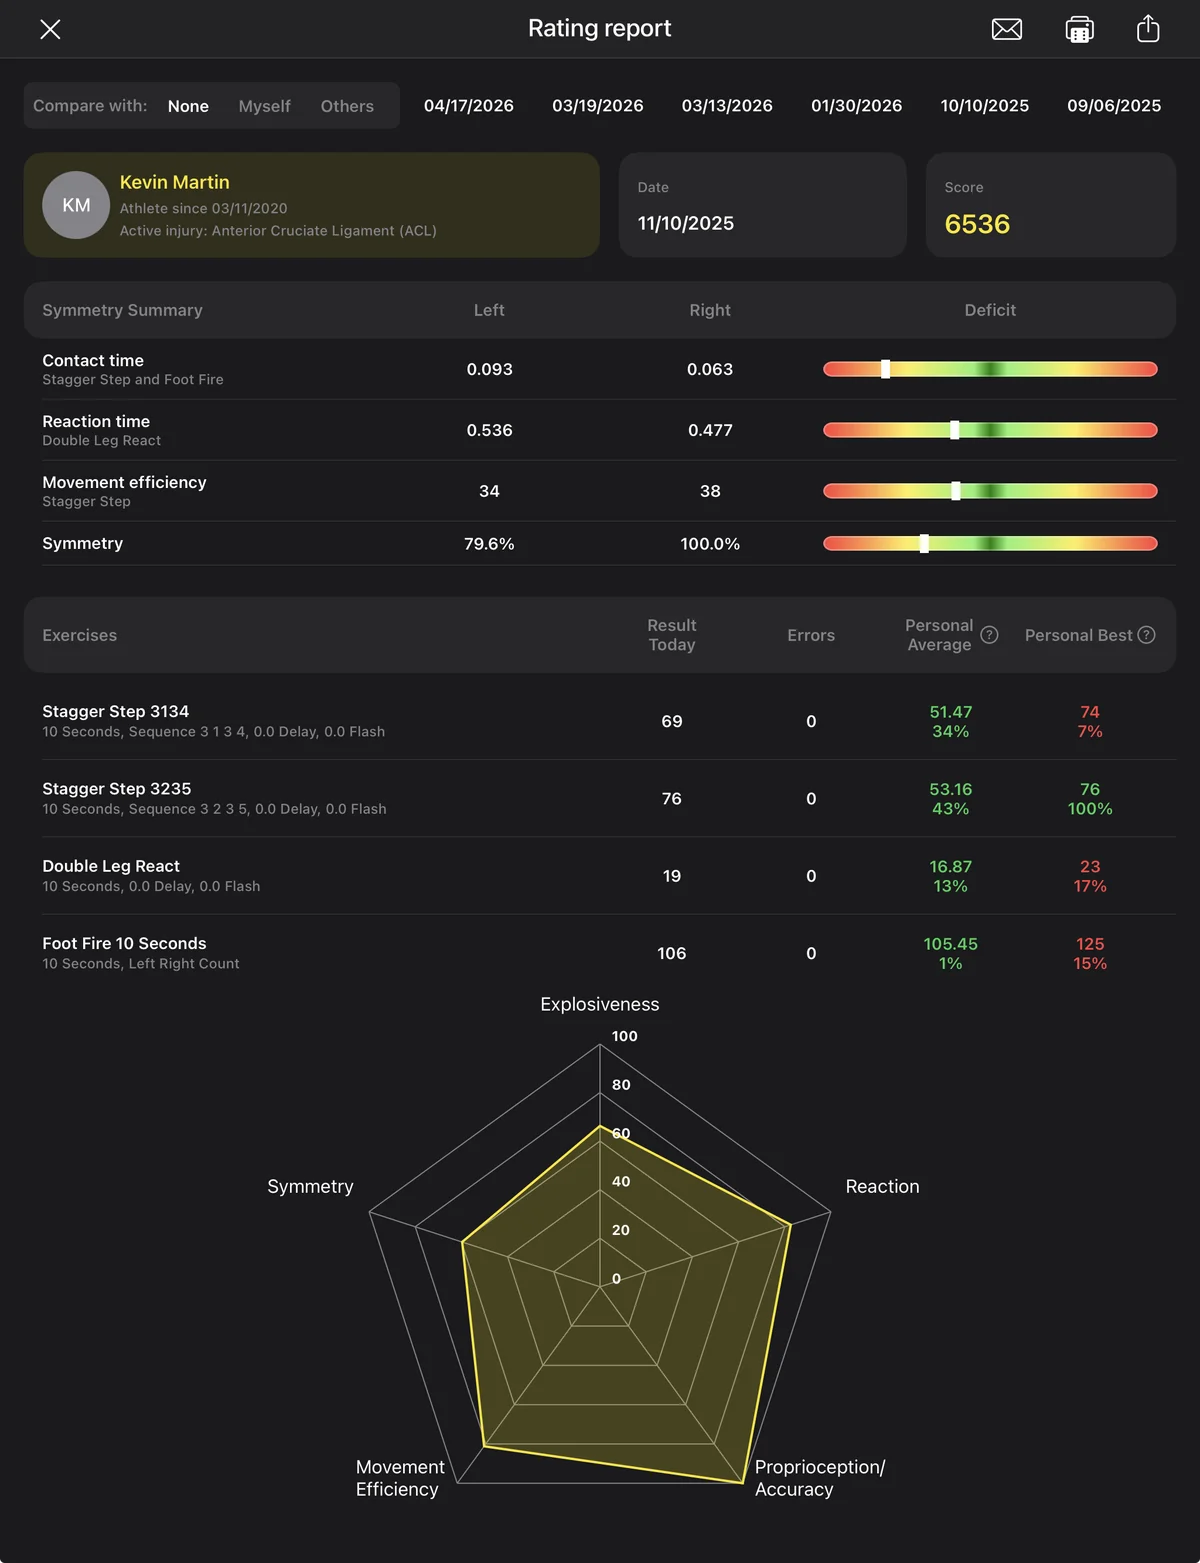
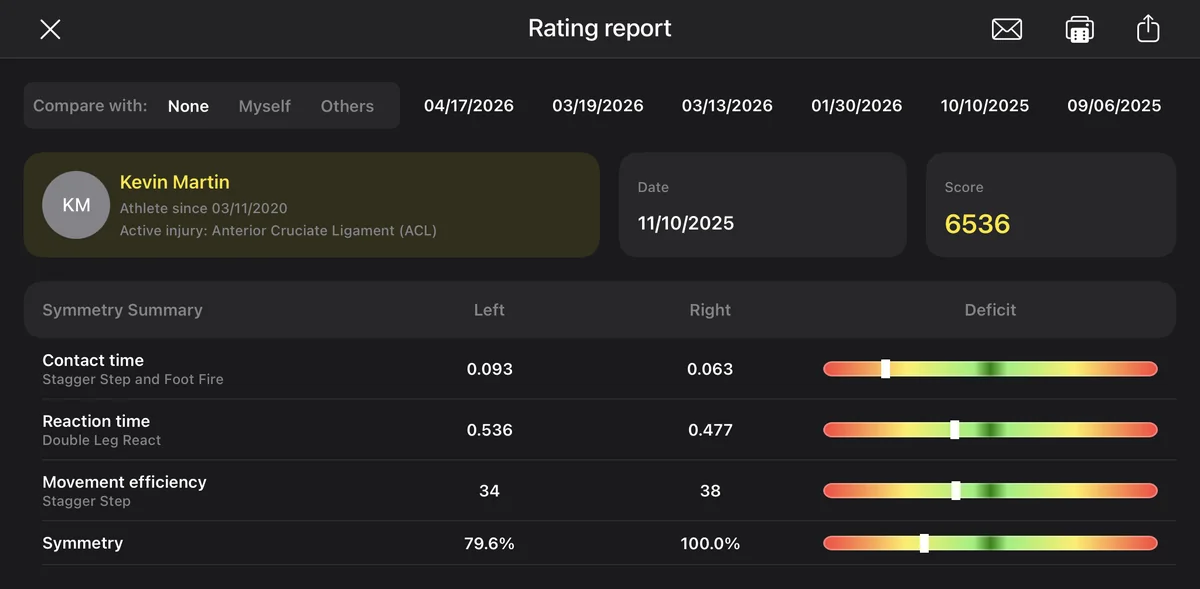
The entire assessment takes less than two minutes to complete. Once finished, the Agility Rating Report includes the composite score, a symmetry analysis, individual exercise results, and a radar chart showing the performance profile.
Billing (PT clinics): CPT 97750 (Physical Performance Test), 15-minute increments. Not billable on eval or re-eval days.
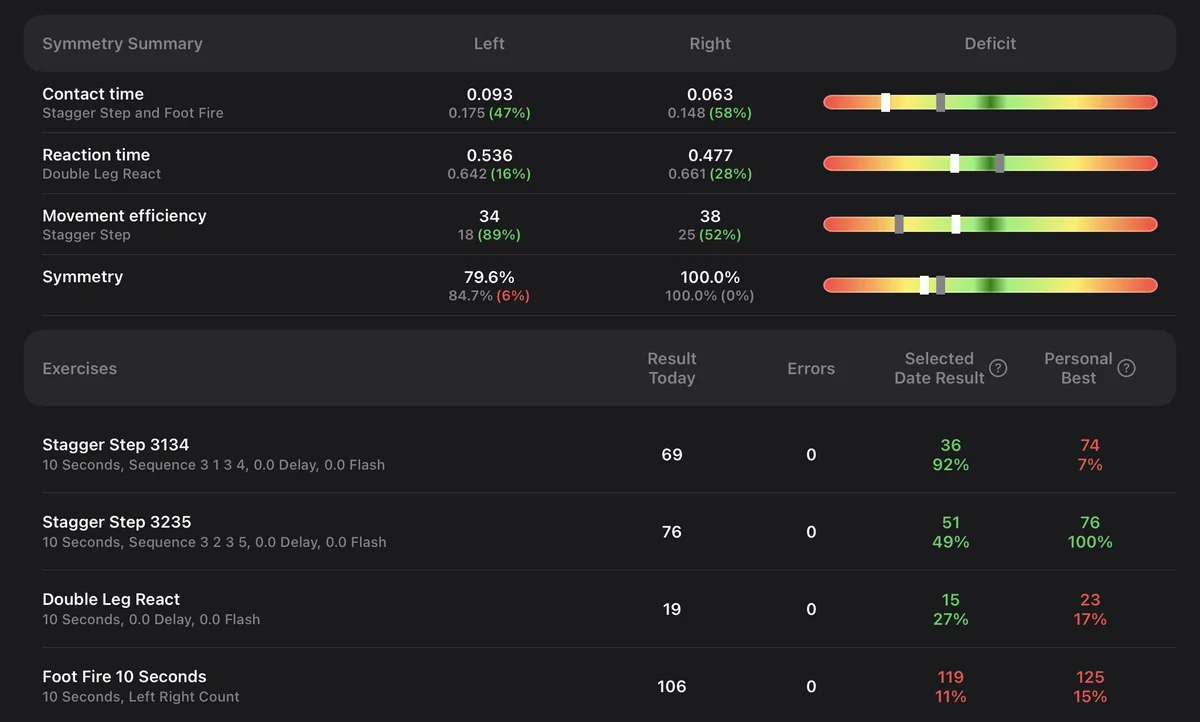
The Agility Rating is calculated from four scored exercises. Stagger Step is performed on each side separately, scored as two of the four, for left-vs-right insight.
Measures lateral movement efficiency. Performed on each side separately. Left and right scored independently to expose bilateral asymmetries central to ortho and neuro rehab.
= Lateral Movement EfficiencyMeasures reaction. User responds to visual cues on the iPad by touching the correct sensor. Reaction time per leg is also captured in milliseconds and shown in the Symmetry Summary.
= ReactionMeasures explosiveness. Rapid-fire foot speed exercise where the athlete accumulates as many touches as possible in 10 seconds. High volume of touches; speed-based scoring.
= ExplosivenessQuickBoard's training model centers on external focus and proprioception. The visual stimulus and real-time movement feedback appear on the iPad screen while sensors sit on the ground. The real-time iPad feedback keeps the user's attention on the screen during exercises, which trains the body the way it functions in sport and daily life: eyes up, processing external stimuli while the feet execute.
Across many studies, an external focus has produced better performance than internal focus training (watching the feet). Cone drills and footwork patterns train rehearsal. The reactive, unpredictable stimuli on the QuickBoard iPad train reaction, which matters for training and rehab where the play is never memorized.
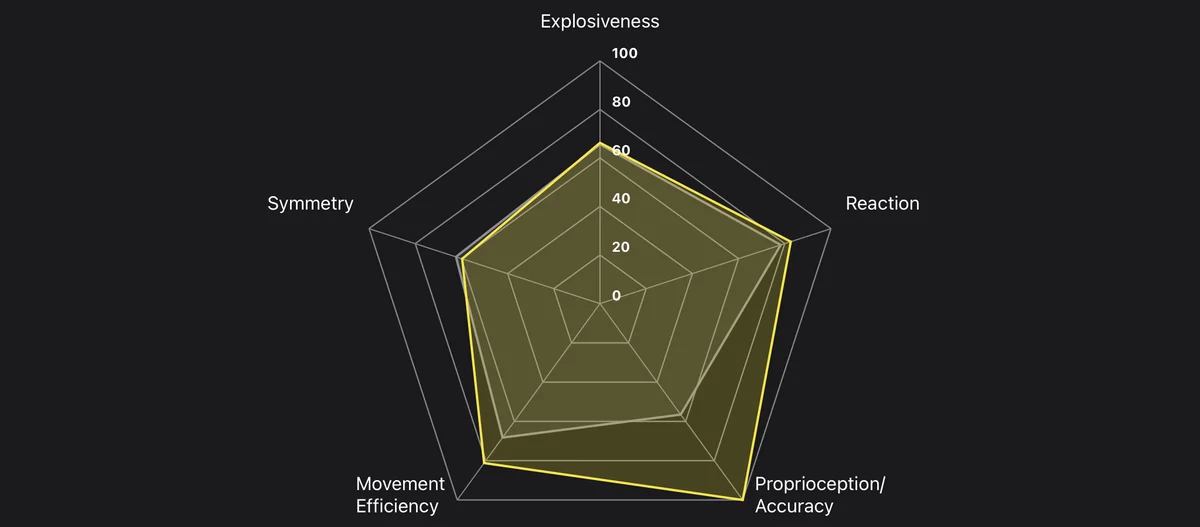
The Agility Rating breaks the composite score into five dimensions. Each axis extends from 0 at the center to 100 at the outer edge, representing percentiles based on the best results in the QuickBoard database. Each dimension maps directly to a recommended workout type.
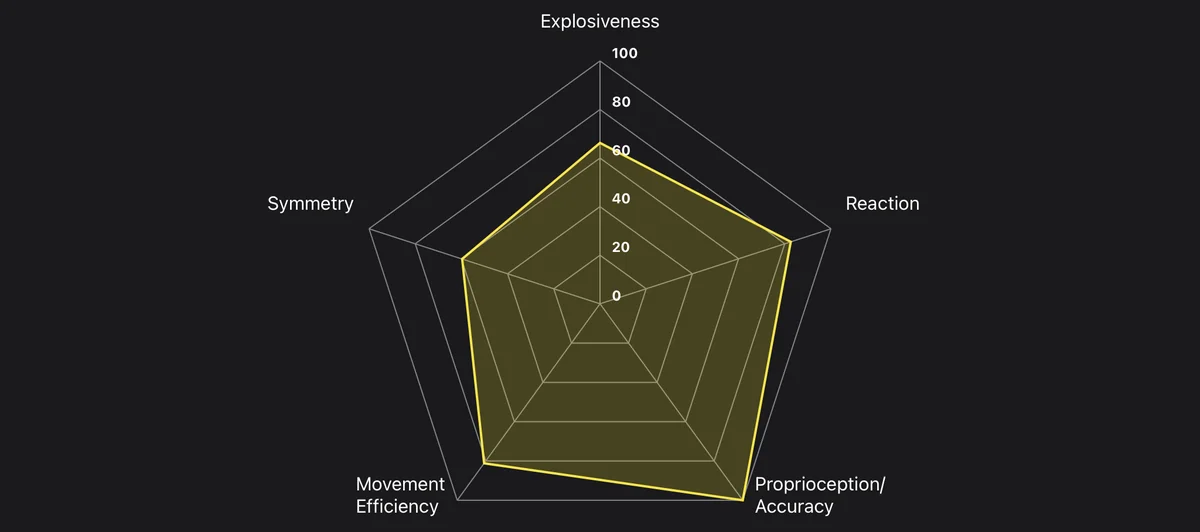
Based on Foot Fire touch count. Higher touches = more explosive. Low scores recommend Speed Workouts.
Based on Double Leg React touch count. More reactions = faster processing. Reaction time per leg (ms) is also captured in the Symmetry Summary. Low scores recommend Reaction Workouts.
Calculated from total touches relative to errors in both Double Leg React and Stagger Step. Fewer errors = better body awareness. Low scores recommend Stability Workouts.
Based on Stagger Step touches and the deficit between left and right sides. More touches with less asymmetry = better efficiency. Low scores recommend Movement Workouts.
Derived from average contact times in Foot Fire and Stagger Step plus reaction time per legs. Even contact times on both sides = higher symmetry. Key for unilateral injuries, post-op cases, and hemiparetic neuro presentations.
Tip: A balanced radar chart indicates well-rounded agility. A lopsided chart shows exactly where to focus training.
The Symmetry Summary at the top of the report compares left and right sides across four metrics with a color-coded deficit bar. Reaction time per legs are captured to millisecond precision.
Once the Agility Rating identifies the weakest dimension, the app automatically recommends the matching workout type at the right progressive level. The Rating diagnoses. The workout prescribes. One iterative training loop.
Three progressive levels. Recommended when the Explosiveness dimension scores low. Foot speed, quickness, acceleration patterns.
Level 1 → Level 2 → Level 3Three progressive levels. Recommended when Proprioception/Accuracy or Symmetry scores low. Bilateral control, deceleration, body position.
Level 1 → Level 2 → Level 3Three progressive levels. Recommended when Movement Efficiency scores low. Change-of-direction, transitions, stride patterns.
Level 1 → Level 2 → Level 3Three progressive levels. Recommended when the Reaction dimension scores low. Stimulus processing, decision speed, cognitive-motor integration.
Level 1 → Level 2 → Level 3The Agility Rating is designed to be tracked over time. Two built-in comparison modes make longitudinal and group analysis immediate.
Compares the current Agility Rating to a previous session. Select any past date and the report shows:
Compares the rating to other athletes or patients at the same location. Filter by Gender, Age, Height, Weight, Sport, Position, and Level. The report shows:
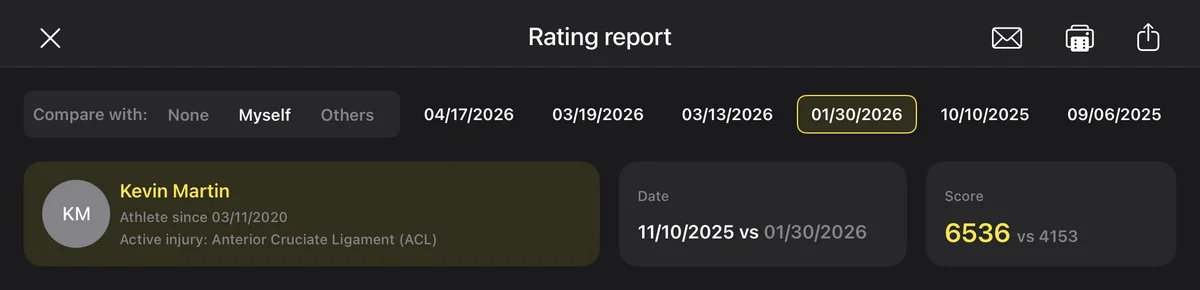
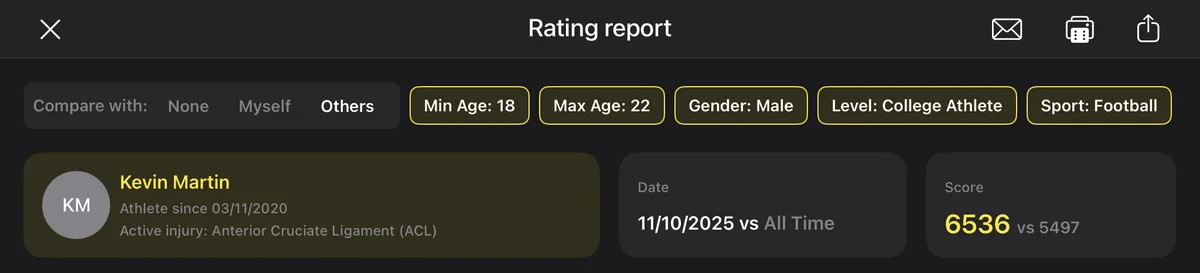
In either comparison mode, the current radar chart (yellow) is overlaid with comparison data (gray) for an instant visual of where the athlete leads or trails.
Note: To enable filtered comparisons, complete the Additional Detail Fields when creating a patient or athlete profile. More completed profiles improve comparison accuracy across your clinic.
The Agility Rating Report is produced automatically after each assessment. No manual writeup required.
What's in the report:
The Agility Rating Report includes four dropdowns that pre-populate clinical documentation for 97750 billing:
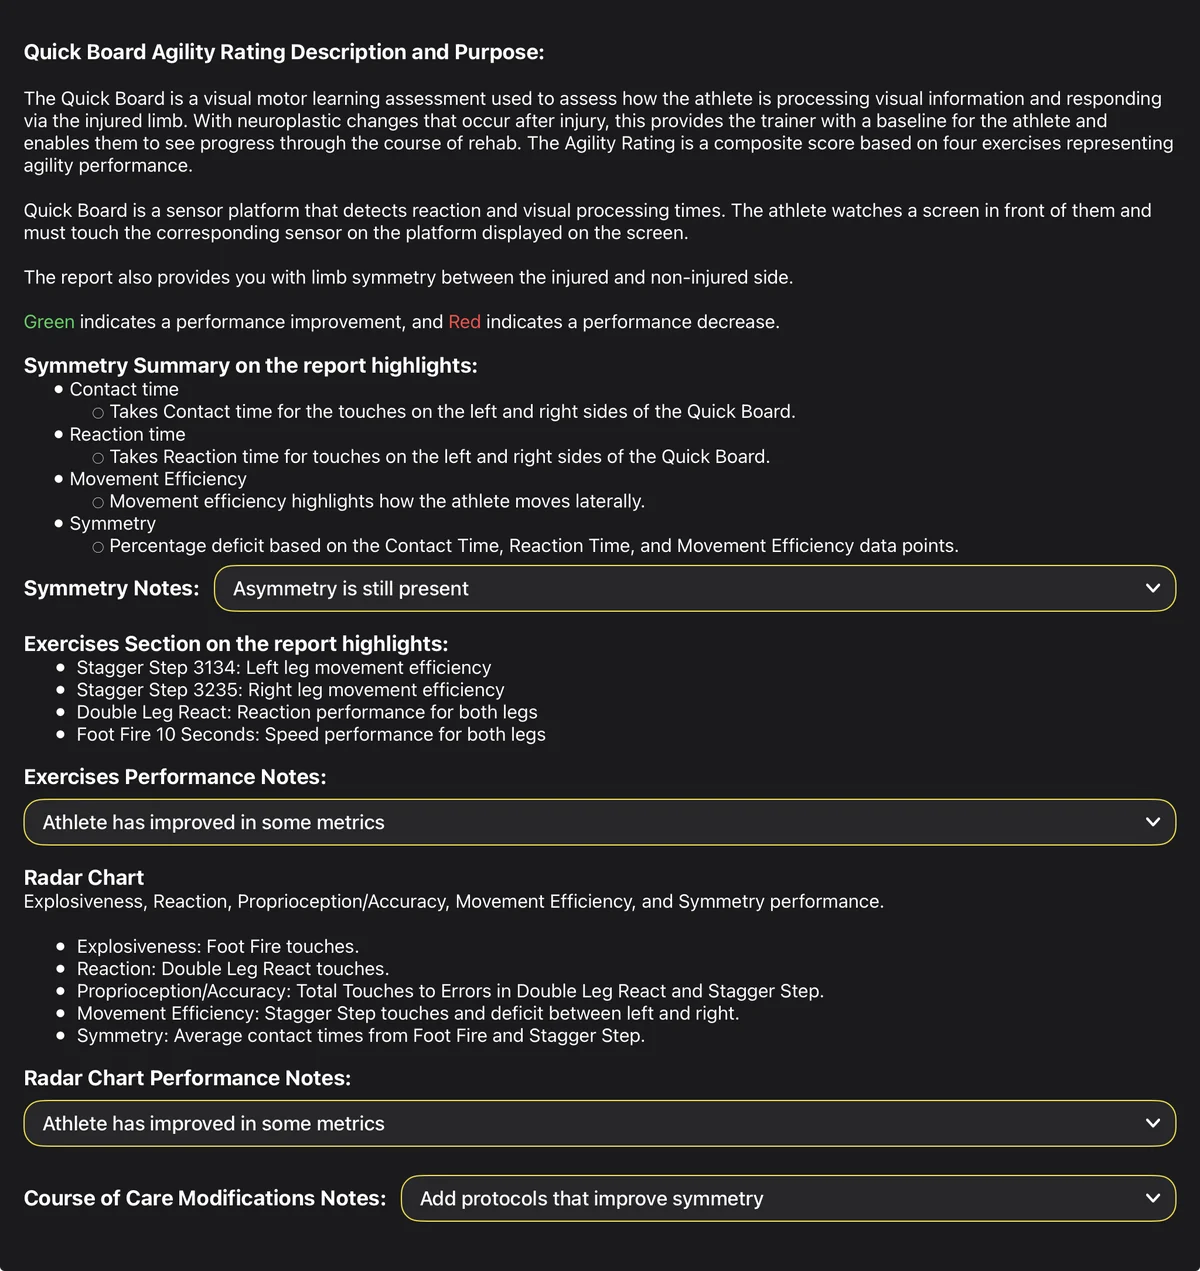
The billing workflow in a PT clinic: because the PDF includes the Description and Purpose text CPT 97750 requires, your patient note can simply reference "see attached." No duplicate documentation. No writing the test justification by hand.
Delivery: reports auto-generate as PDFs and are exported to the clinician's email after each session. The clinician forwards, saves, or shares the file from there.
A validation study at the University of Mississippi confirms a strong correlation between the Agility Rating and force plate measurements, the Star Drill, and the T-test. The university is preparing the manuscript for journal submission. Publication is expected in late 2026.
Teams and clinics use the Agility Rating for baselines, for tracking rehabilitation progress, and for return-to-sport decisions.
A composite score from 0 to 10,000 built from four scored exercises (Stagger Step Left, Stagger Step Right, Double Leg React, Foot Fire). It measures five dimensions: Explosiveness, Reaction, Proprioception/Accuracy, Movement Efficiency, and Symmetry. The assessment takes less than two minutes. PT clinics can bill it under CPT 97750.
Yes. The Agility Rating requires the QuickBoard sensor board. The scored components measure touch count, reaction time (to the millisecond), ground contact time, bilateral symmetry, and accuracy, which require the sensor board hardware. The Rating is not available in the free Agility Drill app.
Double Leg React is measured two ways. The Agility Rating score is driven by touch count over 10 seconds (Poor: below 12 reactions, Average: 13 to 17, Excellent: 18+, all-time record: 23). Separately, reaction time per leg is captured in milliseconds and displayed in the Symmetry Summary of the Agility Rating Report. Both metrics appear on the report: touch count for scoring, millisecond reaction time for bilateral symmetry analysis.
Once the Rating identifies the weakest dimension, the app automatically recommends the corresponding workout type at the right progressive level. QuickBoard includes 12 workouts across four types (Speed, Stability, Movement, Reaction) with three progressive levels each. The Rating diagnoses the gap; the workout closes it.
The Agility Rating Report is an automatically generated PDF produced after the assessment. It includes the composite score, the five-dimension radar chart, bilateral symmetry breakdowns with millisecond reaction times, individual exercise results, and the Description and Purpose text a PT clinic needs for CPT 97750 billing. The clinician's patient note can simply reference 'see attached.' Reports auto-generate as PDFs and are exported to the clinician's email after each session.
QuickBoard's training model centers on external focus and proprioception. The visual stimulus and real-time movement feedback appear on the iPad screen while sensors sit on the ground. The real-time feedback keeps the user's attention on the screen during exercises rather than on the feet, which trains the body the way it functions in sport and daily life: eyes up, processing external stimuli, while the feet execute. External focus is associated in motor learning research with improved skill transfer compared to internal focus training.
In a physical therapy clinic, the Agility Rating assessment is billable under CPT 97750 (Physical Performance Test) in 15-minute increments. Protocol sessions bill under CPT 97530 (Therapeutic Activities) or CPT 97112 (Neuromuscular Re-education) depending on intent. 97750 cannot be billed on eval or re-eval days. 97530 and 97112 follow the 8-minute rule.
Yes. The free Agility Drill app runs reactive agility drills and workouts on the iPad alone without any hardware. The Agility Rating assessment (and the Rating-recommended workouts described on this page) require the full QuickBoard system with the sensor board for the objective bilateral symmetry data and millisecond-precision measurements.
A QuickBoard rep walks your team through one or two pre-built protocols, runs an Agility Rating session, and shows the auto-generated reports.